Executive Intelligence: RevPASH, Labor Ratios, Menu Engineering & Unit Economics
October 8, 2026 in Franchise Governance & Multi-Unit Control
The Limitations of Top-Line Sales: Why Gross Revenue Lies
When restaurant general managers proudly announce that Saturday dinner generated ₹2,50,000 in gross revenue, they are sharing only a fraction of the financial story. High gross revenue can easily mask disastrous operational inefficiencies:
- What if labor overtime costs required to generate that revenue ate up 40% of the sales?
- What if uncalibrated kitchen portions pushed food costs to 38% instead of the budgeted 28%?
- What if the restaurant suffered a 12% bill void ratio that masked extensive staff cash pocketing?
True operational mastery requires moving beyond basic top-line sales and tracking the 7 core unit-economic metrics that dictate actual restaurant survival and expansion.
The 7 Essential F&B Metrics Every Operator Must Monitor
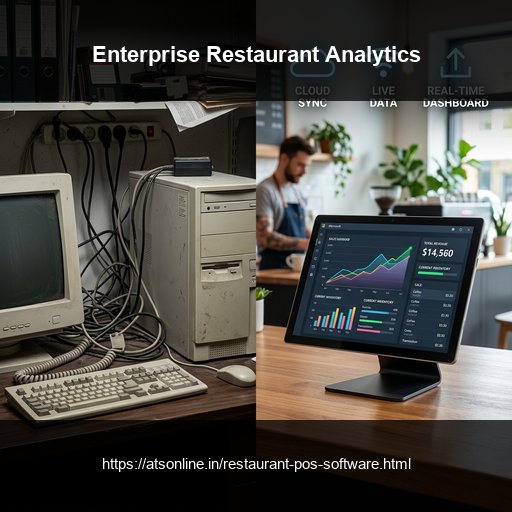
ATS Enterprise Analytics Hub tracks these 7 vital metrics continuously in real-time dashboards:
1. RevPASH (Revenue Per Available Seat Hour): `RevPASH = Total Revenue / (Available Seats × Operating Hours)` Measures dining room asset utilization. Identifies whether dead afternoon hours can be monetized through high-tea specials or remote work bundles. 2. Prime Cost Percentage (Food Cost % + Labor Cost %): The holy grail of F&B financial health. Top-tier restaurant operations maintain Prime Cost strictly below 55% to 60% of gross revenue. 3. Table Turnaround Velocity (TTV): Average minutes elapsed from guest seating to bill settlement and departure. Shaving 12 minutes off TTV unlocks 20%+ more weekend covers. 4. Item Sales Velocity & Contribution Margin (Menu Engineering): Categorizes menu offerings into Stars (High volume, High margin), Plowhorses (High volume, Low margin), Puzzles (Low volume, High margin), and Dogs (Low volume, Low margin). 5. Void, Cancellation, and Comp Ratios: Measures the total value of cancelled KOTs and bill discounts. Any figure exceeding 2.0% to 2.5% of gross sales signals urgent need for operational auditing. 6. Delivery Channel Net Realization: Audits gross order sales on Swiggy and Zomato against net bank payouts after platform commissions, discounts, and packaging costs. 7. Customer Repeat Frequency & NPS: Tracks the percentage of weekly diners who are repeat visitors, providing leading indicators of customer retention.
Automated Morning Executive Briefs Delivered to Your Phone
Restaurant executives do not have time to sift through 50-page complex PDF reports every day.
ATS POS automatically compiles an Executive Morning Snapshot delivered directly via WhatsApp or email at 8:00 AM: summarizing yesterday's net revenue, Prime Cost percentage, top-performing outlets, and anomalous inventory variances across your entire restaurant enterprise in one clean visual scorecard.
Comparison Matrix
| Metric | Target Benchmark | Why It Matters | ATS Automated Tracking |
|---|---|---|---|
| Prime Cost (Food + Labor) | 55% – 60% of gross revenue | The ultimate indicator of restaurant profitability | Live calculated on executive dashboard |
| RevPASH | Increases during peak shifts | Measures seat and dining room real estate efficiency | Automated hourly seating analysis |
| Table Turnaround Time | 45 to 65 mins (Casual/QSR) | Maximizes peak weekend dining covers | Timestamped from table seat to settlement |
| Void & Discount Ratio | < 2.0% of total revenue | Exposes cashier embezzlement and kitchen errors | Real-time supervisor alert thresholds |
| Menu Engineering Margin | 68% – 74% gross margin | Identifies which dishes generate real bankable profit | Live plate-cost calculation from vendor bills |
Frequently Asked Questions
What is RevPASH and why is it important for restaurants?
RevPASH stands for Revenue Per Available Seat Hour. It measures how effectively you generate revenue from your dining room capacity across each hour of the day, helping optimize staffing and seating.
What is considered a healthy Prime Cost percentage in F&B?
In modern restaurants, a healthy Prime Cost (Food Cost + Labor Cost) is between 55% and 60% of gross sales. Operating above 65% puts the business at high risk of operating losses.
Can owners view consolidated sales across multiple outlets on their smartphone?
Yes! ATS Cloud Analytics provides a responsive mobile portal and automated 8:00 AM WhatsApp executive briefs summarizing performance across all outlets.
How does ATS help with menu engineering?
The system plots every menu item on a profitability vs. popularity matrix, helping you identify high-profit favorites and redesign or reprice unprofitable dishes.
Ready to Modernize Your Operations?
Transform your business with enterprise-grade restaurant POS solutions from ATS Online. Get real-time cloud control, rapid customer checkouts, automated recipe costing, and 100% operational uptime.
Or call our restaurant tech specialists directly at: +91-9810078010
Conclusion
Running a modern multi-unit restaurant brand on gut feel and delayed monthly profit-and-loss statements is a recipe for stagnation. By monitoring real-time enterprise KPIs, RevPASH metrics, and labor efficiency ratios through ATS Online's executive reporting hub, F&B leaders steer their restaurant chains toward sustained profitability and institutional-grade valuation.
Upgrade to ATS hospitality POS and automation solutions today. Visit ATS Cloud Restaurant POS, call us at +91-9810078010, or email ats.fnb@gmail.com for live product demonstrations.
Related Reading
- How Cloud Restaurant POS Software Drives Speed, Higher Margins, and Multi-Outlet Scale
- Smart Inventory and Recipe Costing: How Restaurants Stop Food Waste and Protect Margins
- Central Kitchen and Commissary Management: How Restaurant Chains Streamline Multi-Store Supply Chains
- Kitchen Display Systems (KDS) vs. Paper KOTs: Accelerating Kitchen Turnaround Time