Culinary Cost Engineering: Standard Yields, Variance Formulas & Margin Recovery
October 8, 2026 in Food Cost & Inventory Management
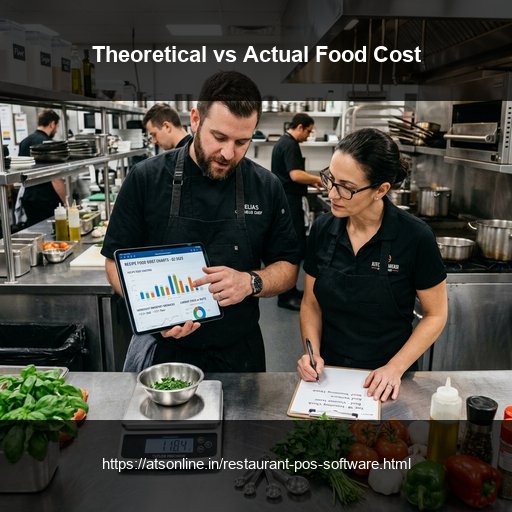
The Core Problem: Why Overall Food Cost Percentage Hides Major Losses
Most restaurant owners celebrate when their month-end food cost finishes at 31%, assuming their kitchen operations are financially sound. However, broad top-level percentages often conceal massive internal leaks. If your menu pricing and recipe formulation were engineered to produce a 26% theoretical food cost, that 5% variance represents lakhs of rupees lost to invisible kitchen shrinkage:
- Uncalibrated Portioning: Line cooks serving 240g of marinated chicken per entree instead of the standardized 200g recipe spec quickly burn through tons of excess protein over a month.
- Evaporation & Trimming Loss: Prep cooks discarding excessive trim on tenderloins or vegetables without logging trim yields.
- Unrecorded Staff Tastings & Comps: Kitchen staff cooking off-menu snacks or remaking customer orders without ringing supervisor remake slips into the POS.
The Mathematical Formula: Calculating Theoretical vs. Actual Variance
ATS Cloud Restaurant POS automates the complex mathematical auditing required to pinpoint variance down to the exact gram:
1. Theoretical Consumption (Ideal Usage): The system multiplies every dish billed by its mapped recipe Bill of Materials (BOM). If 150 butter chicken dishes are sold, ideal chicken breast usage is exactly 30.0 kg. 2. Actual Consumption (Physical Usage): Calculated from physical inventory counts: `Actual Usage = (Opening Stock + Purchases + Inward Transfers) - (Closing Stock + Outward Transfers)`. 3. Variance Percentage Formula: `Variance = Actual Cost - Theoretical Cost` `Variance % = (Variance / Theoretical Cost) * 100`
When variance exceeds acceptable kitchen tolerances (typically 1.5% to 2.5%), ATS POS generates automated discrepancy alerts for head chefs and financial controllers.
Isolating Variance by Specific Kitchen Stations
A general kitchen variance alert leaves managers guessing where the loss occurred. ATS Recipe Costing isolates consumption by specific prep stations:
- Butchery & Protein Station: Tracks raw meat yield, moisture loss, and trimming efficiency against butchery yield tests.
- Bakery & Dough Station: Audits flour, dairy, and butter batch yields.
- Bar & Beverage Counter: Flags peg pour variance and draft beer keg line loss.
Pinpointing exact station accountability removes guesswork and empowers head chefs to correct line behavior immediately.
Comparison Matrix
| Variance Metric | Manual End-of-Month Clipboard | ATS Automated Recipe Cost Engine |
|---|---|---|
| Calculation Speed | Days of spreadsheet math after month ends | Instant real-time daily variance reports |
| Portion Drift Detection | Undetected; buried inside total food purchases | Gram-level portion variance per menu dish |
| Station Attribution | Lumped together as general kitchen loss | Isolated by prep station (Butchery, Fry, Bar) |
| Trim & Yield Factoring | Ignored; static raw purchase weights used | Dynamic yield percentages factored per ingredient |
| Financial Recovery | Zero visibility into ongoing shrinkage | Recovers 3% to 7% of gross food margin |
Frequently Asked Questions
What is theoretical food cost in a restaurant?
Theoretical food cost is the ideal cost of food that should have been spent based on the exact quantity of dishes billed multiplied by standard recipe ingredient costs.
What is considered an acceptable food cost variance percentage?
In well-managed commercial kitchens, an acceptable variance between theoretical and actual food cost is between 1.0% and 2.5% to account for normal cooking shrinkage and moisture loss.
How does ATS POS track raw ingredient prep yields?
ATS recipe cards support prep yield percentages (e.g., 85% usable yield on onions after peeling) to ensure theoretical consumption matches culinary reality.
Can head chefs view variance reports on their smartphones?
Yes. ATS POS provides cloud management dashboards with daily variance rankings showing which ingredients have the highest discrepancy.
Ready to Modernize Your Operations?
Transform your business with enterprise-grade restaurant POS solutions from ATS Online. Get real-time cloud control, rapid customer checkouts, automated recipe costing, and 100% operational uptime.
Or call our restaurant tech specialists directly at: +91-9810078010
Conclusion
Tracking theoretical versus actual food cost is the gold standard of professional F&B financial management. By embedding automated ingredient BOMs and daily variance auditing with ATS Online, restaurateurs eliminate kitchen blind spots, halt portion drift, and recover 4% to 7% of gross sales straight to their bottom line.
Upgrade to ATS hospitality POS and automation solutions today. Visit ATS Cloud Restaurant POS, call us at +91-9810078010, or email ats.fnb@gmail.com for live product demonstrations.
Related Reading
- How Cloud Restaurant POS Software Drives Speed, Higher Margins, and Multi-Outlet Scale
- Smart Inventory and Recipe Costing: How Restaurants Stop Food Waste and Protect Margins
- Central Kitchen and Commissary Management: How Restaurant Chains Streamline Multi-Store Supply Chains
- Kitchen Display Systems (KDS) vs. Paper KOTs: Accelerating Kitchen Turnaround Time